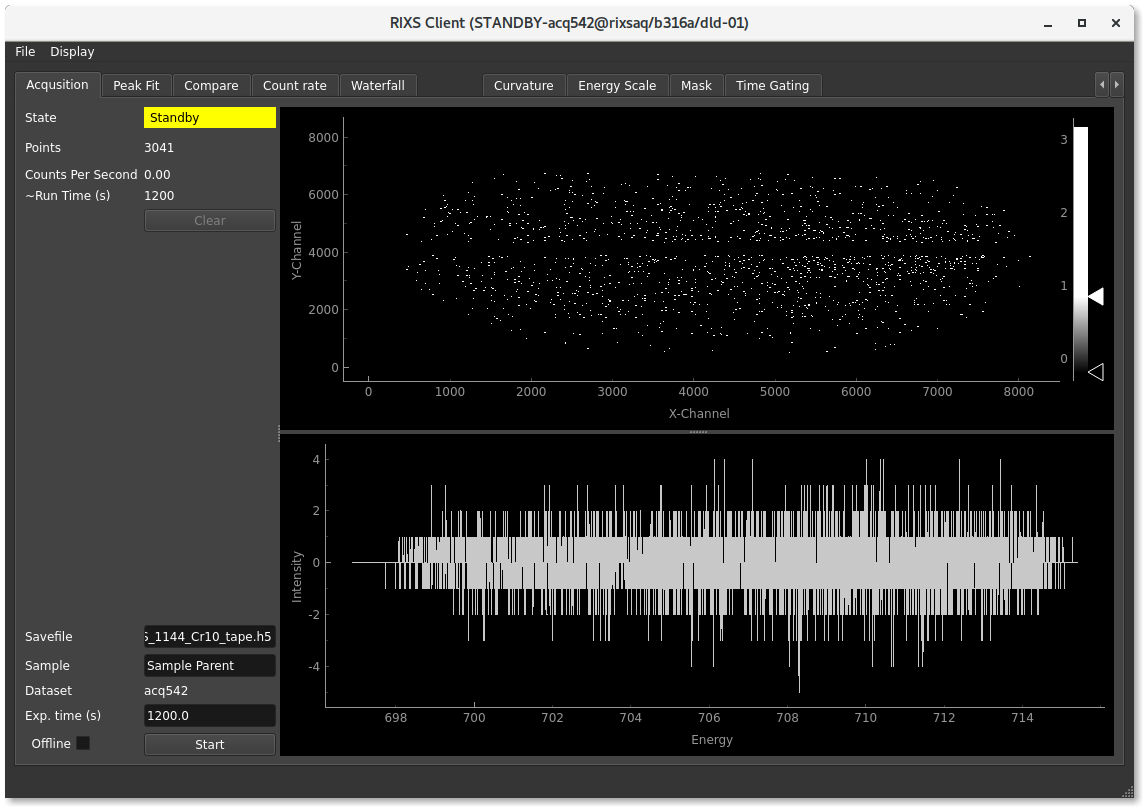
RIXS Client
How to start it:
In menubar: “MAXIV Rixsaqclient DLD1”
In terminal: “/usr/local/bin/ctrixsaq rixsaq/b316a/dld-01 rixsaqfit/b316a/dld-01”
What does it do? It records RIXS data, it can be great for experiments.
When do I need to use it?
Gitlab link: https://gitlab.maxiv.lu.se/species/app-maxiv-rixsaq
Calibration
Each photon hitting the detector is recorded, but to produce a final spectrum a few calibration steps are taken. The points are processed in the following order:
Understanding
The calibration routines in the data pipeline is processed on a point-by-points basis. N.b. that in some cases it might be beneficial to instead work on imagedata. The calibration is applied in the following order:
Time gating is used to filter out the photon hits that occured between the light flashes of the synchrotron.
A curvature correction algorithm is applied to the points
Masked portions of the detector area is removed
The 2D image is summed along the vertical axis, creating the spectrum
The dark spectrum is subtracted.
Correctly setting a calibration
This should be repeated after every move of energy in the emission spectrometer.
Here are the steps needed to make a nice calibration, note that it is important to do this before setting an energy scale, since the curvature correction can move the peaks slighly on the emission axis.
Make a measurement with a line in the center of the detector.
Go to the tab “Time gating” move and adjust the green marker so that it selects the area with synchrotron light. If the x-axis on the histogram is very different from the example, the modulo might need to be changed. Change to “expert mode” to view it.
If you will do long exposures, it might be beneficial to also check “Subtract dark”, and to move the red-area to a suitable position.
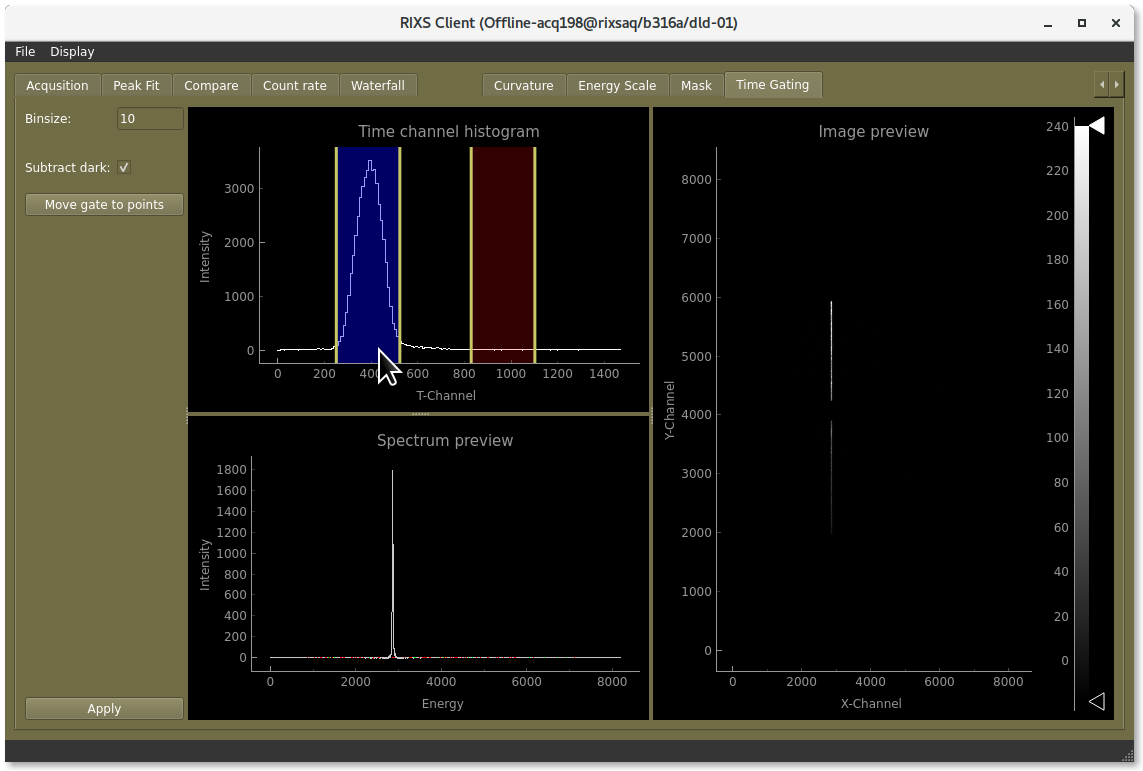
Drag the green-area to select where in time you want to select the hits on the detector
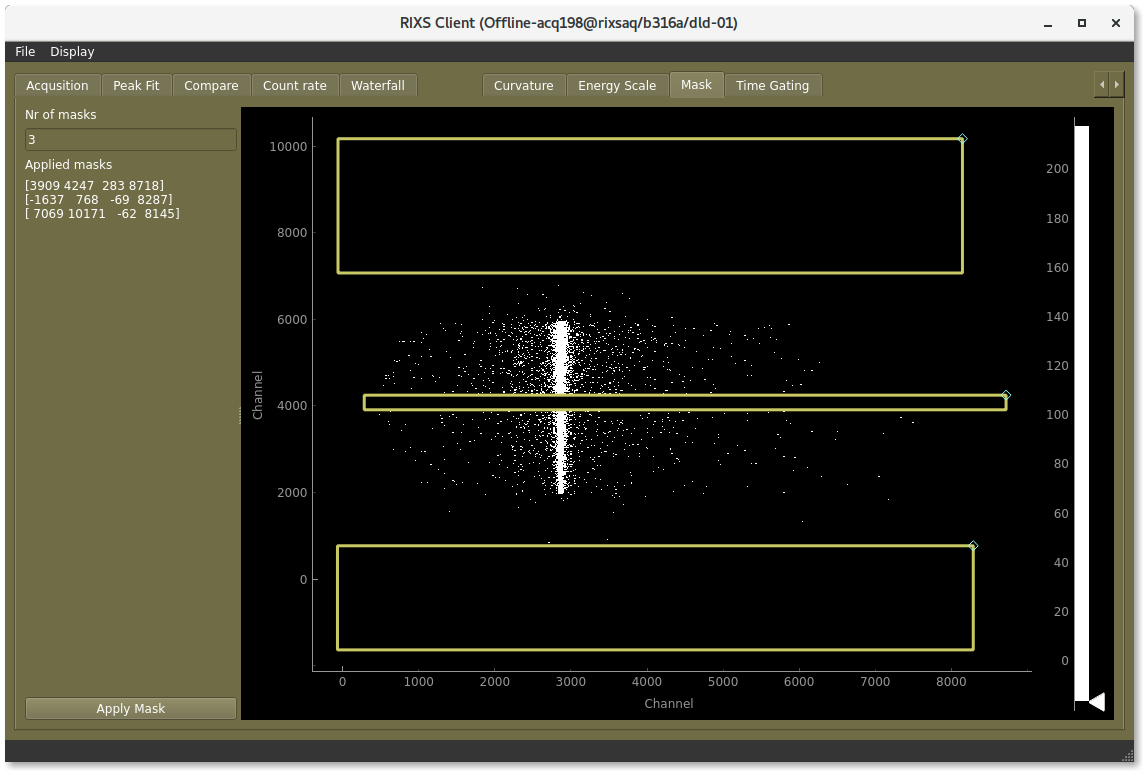
Go to the tab “Mask”, and make sure the masks are not covering the edges of the line. We need as much as possible of the line for a good curvature correction. The line-finding in the curvature correction is working on masked data (although the raw image is displayed).
Make sure the line is not masked out
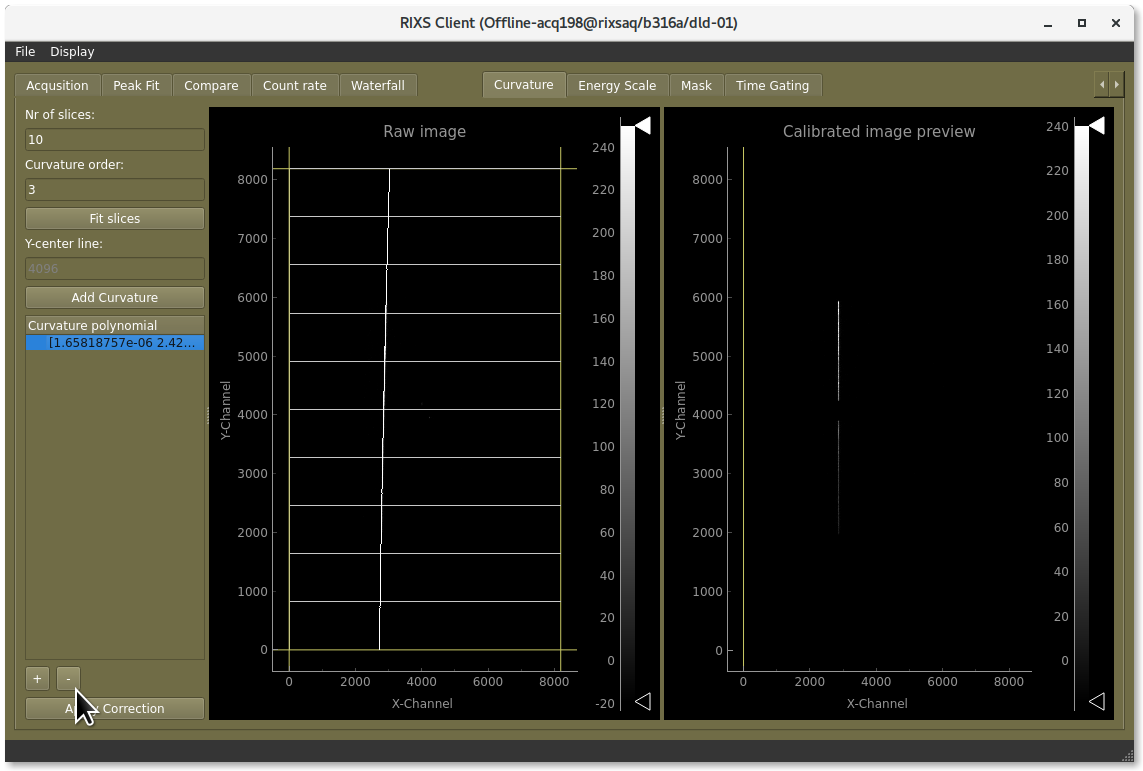
Go to the tab “Curvature”, select the curavature in the list and click “-” to remove it.
Remove the old curvatures
Adjust the intensity so that you can see the line clearly by dragging the white marker towards lower values.
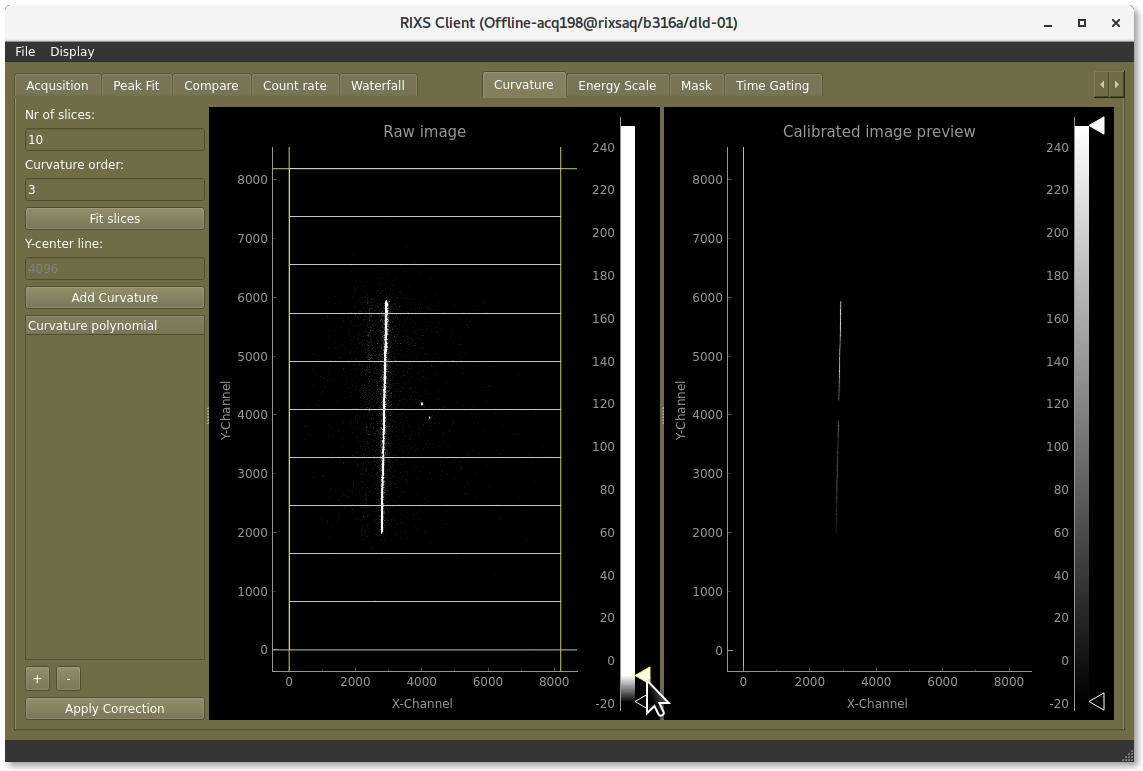
Adjust the intensity so that you can see the line clearly.
Drag the edges of the box so that it covers the line, but not much more.
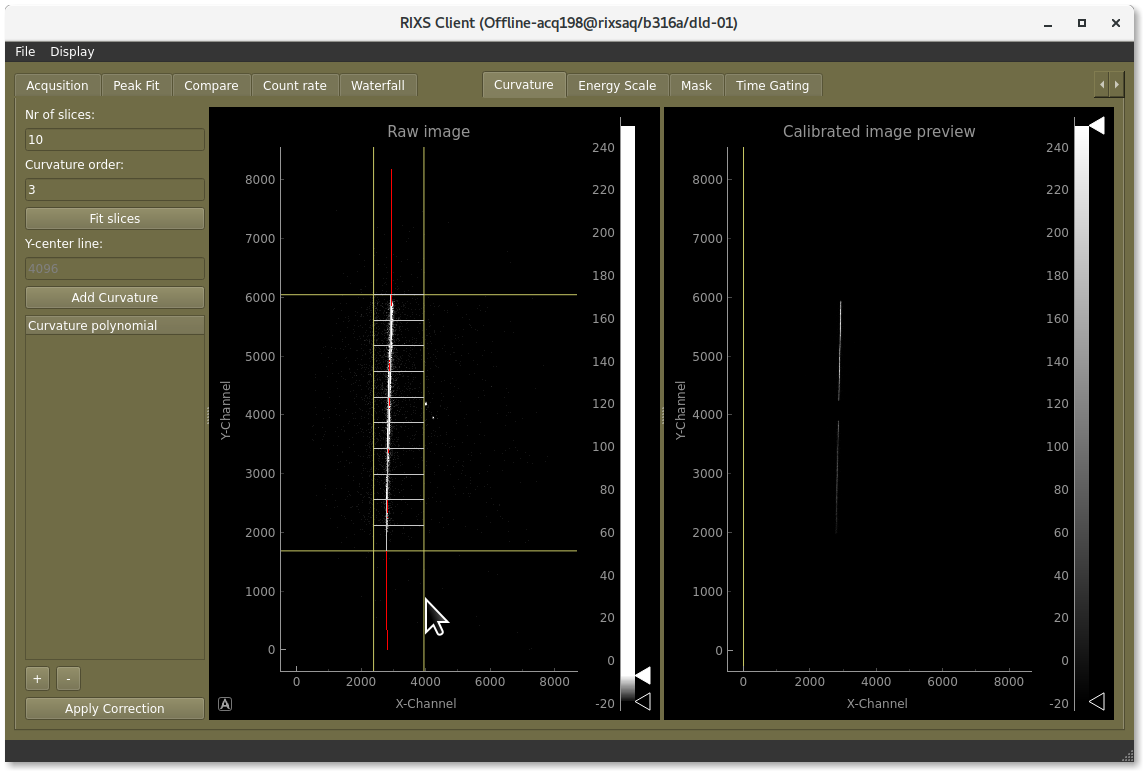
Adjust the corners of the box so that it covers the line.
Make sure the red line finds the measured line nicely, you can drag the white pieces of each slice for manual adjustments
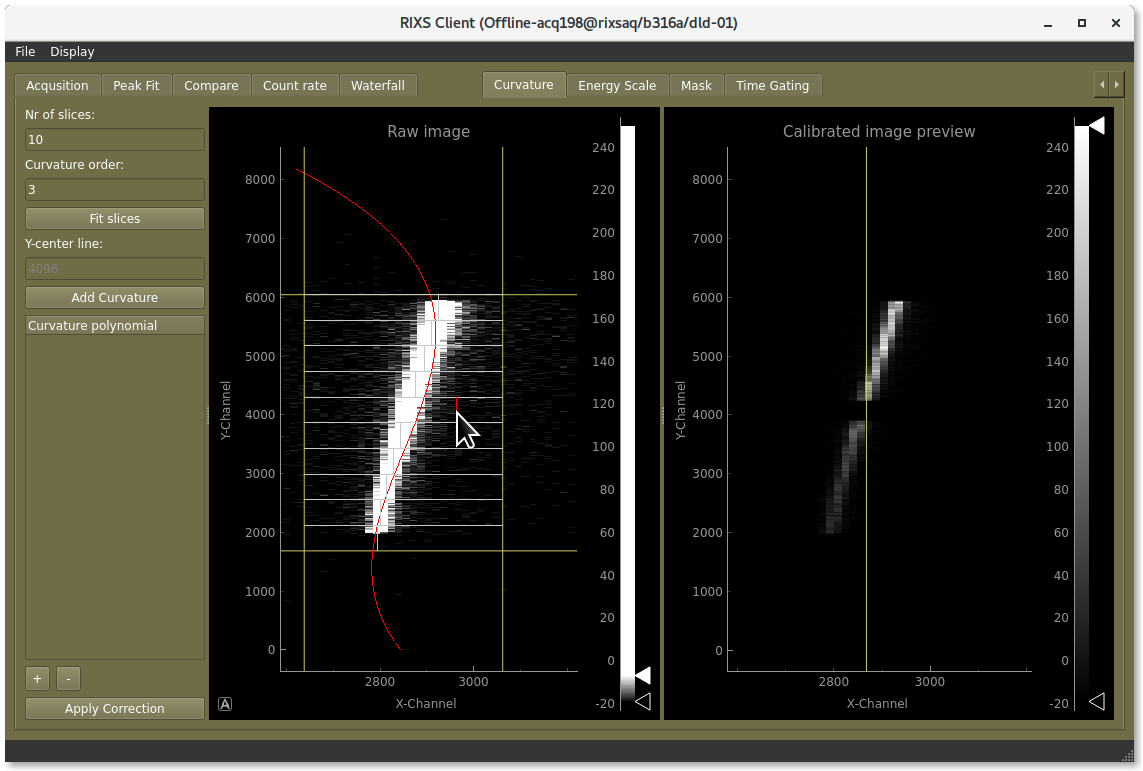
Adjust the fits if needed.
Click the “+”-button to add the curvature. You see a preview of the correction to the right
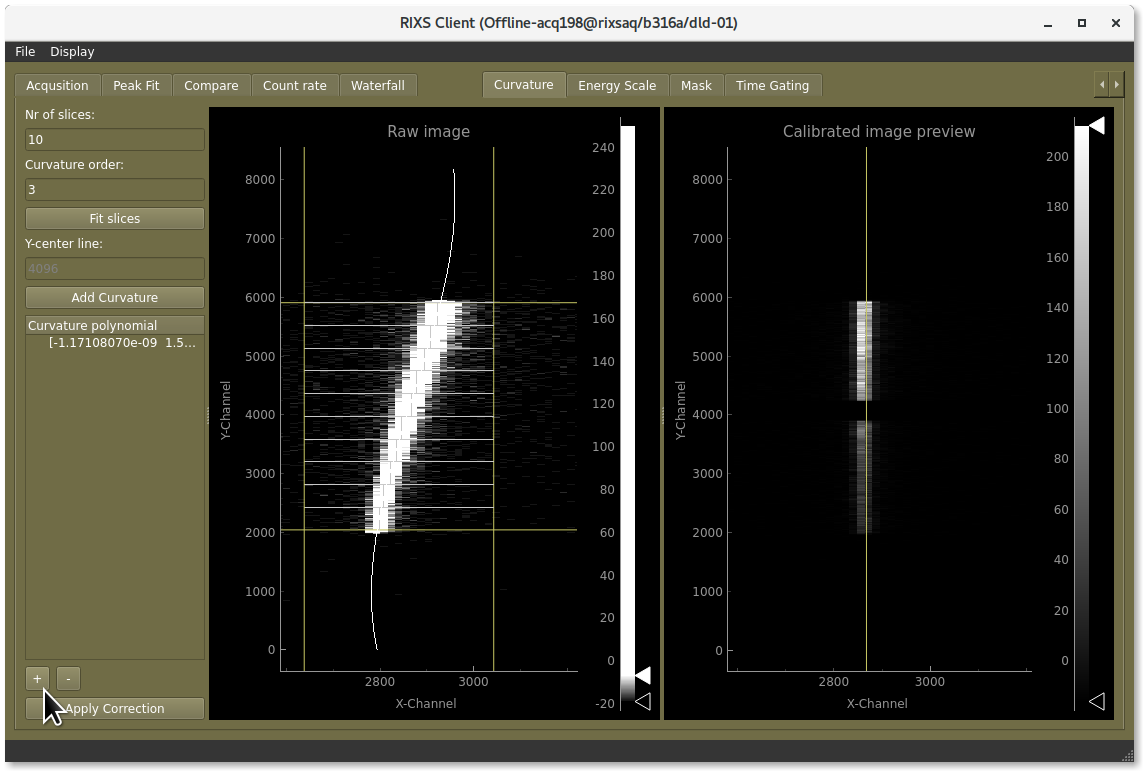
Click the “+”-button to add the curvature
Click the button “Apply correction”
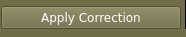
Don’t forget to apply the curvature correction
Go to the mask-tab and add or adjust the masks as needed. They are moved by dragging them with the mouse, their size is adjusted by dragging the small marker in their top-right corner. Don’t forget to click “Apply”
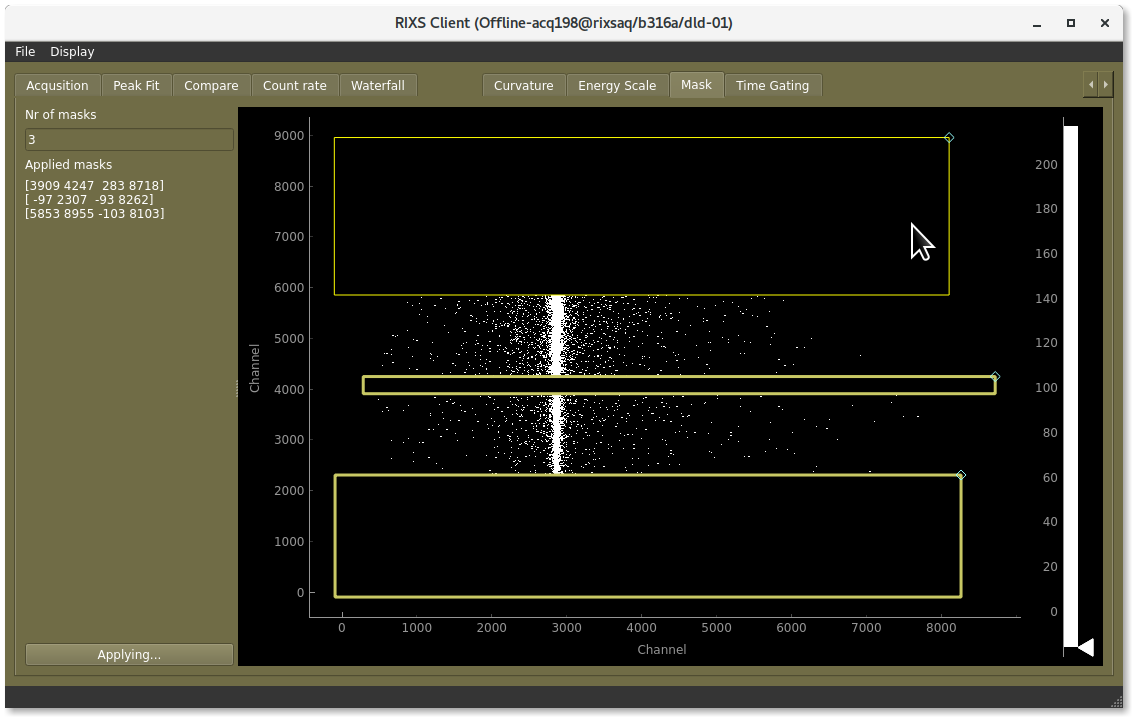
Adjust the masks to cover areas you don’t want included.
Now you have made the calibration, and you are ready to set an energy scale.
Setting an emission energy scale
First make sure you have set up the other steps of the calibration
Go to the tab “Energy scale”, remove the old energy scale by clicking the “-“-button then clicking “Apply scale”
Measure a few known lines across the detector, for example elastic lines with known monochromator energy.
Fit or otherwise estimate the channel number for each energy.
Add the to the table in the “Energy scale”-tab by clicking “+” to add a row then adjusting its energy, and channel number. You can also drag the line to the right to set the channel.
Apply the scale
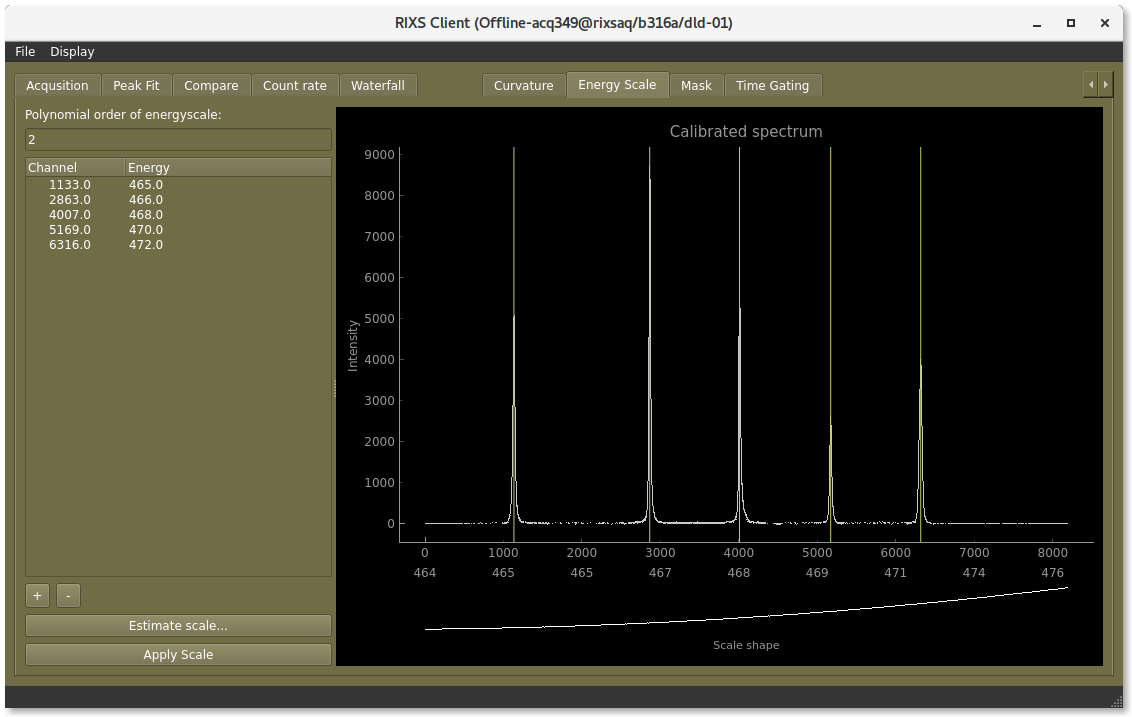
The energy scale is set by inputting a table of detector channels with corresponding photon energies.