Summary of the Tuning Process
At the Veritas beamline, the RIXS spectrometer utilizes a mirror to collimate the signal from the sample onto a 2D imaging detector (MCP with DLD). The parabolic Collimating Mirror is located approximately 1.1 m after the sample, this 980 mm long mirror collects the scattered X-rays and collimates them in the horizontal plane. This increases transmission efficiency without requiring an excessively wide detector. Because of this optical geometry, the vertical position of the signal on the detector (the Y-axis) is directly sensitive to the sample’s position along the horizontal beam axis (the Z-axis in lab coordinates).
Where is sweet spot?
 {width=300px}
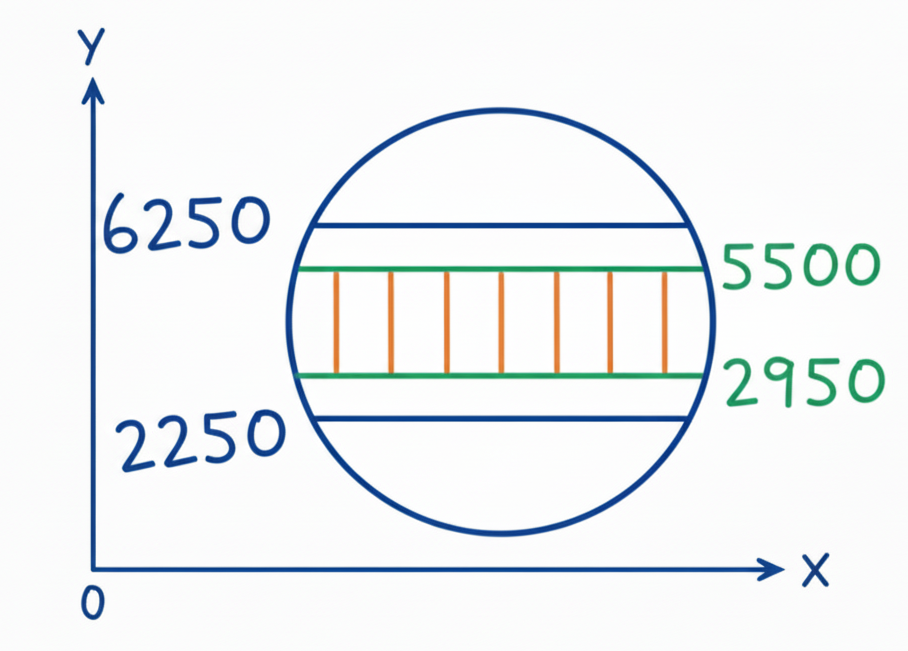
The diagram serves as a visual guide for the “sweet spot” or optimal range for sample alignment:
X axis correspoind to energy axis, and Y axis corresponding to horizontal position. The Blue Outer Bounds (6250 to 2250): These numbers represent the Y-axis limits on the detector. If the signal falls outside this range, the sample is significantly out of alignment along the Z-axis, and the signal may be lost or clipped by the spectrometer optics.
The Green “Optimal” Zone (5500 to 2950): This narrower band represents the target region for the signal. For high-resolution RIXS measurements, the user must adjust the sample’s Z-position until the emission signal sits comfortably between these two green lines to keep resolution good.
The Orange Vertical Segments: These represent the actual signal (the “spectrum” or “elastic line”) as it appears on the detector. The goal of Z-axis tuning is to ensure these orange bars are centered and correctly framed within the green boundaries.
Tuning Logic
If the signal is above 5500: The sample is likely too far upstream, requiring a Z-axis adjustment toward neative direction to “push” the signal down.
If the signal is below 2950: The Z-axis needs to be adjusted in the positive direction to “pull” the signal back into the optimal green window.